Visualizing My Blog’s Internal Links
I recently read a post which spurred an idea in my head. For the life of me I can’t find the original post. I looked in my notes, my RSS reader, my browser history — nothing.
So I’m writing this post without citing the original source — maybe if you know it, you can reach out to me.
The post was about links and the author said something like: “You don’t need to create tags in your writing. Your links are tags.” That struck me. While I’m not quite ready to abandon the semblance of structured tagging on my blog, the idea of thinking about links as tags was intriguing.
It made me want to see the links I’ve created on my own blog. Consider it pompous, but I link to myself a lot. It’s my way of connecting ideas in my brain, even if I don’t formally tag them.
I wrote previously about indexing the outbound links on blog, which helped me see where I link to most frequently on the web. This idea is similar, except instead of indexing outbound links, I want to index internal links – links from one post to another on my blog – and then visualize that data as a set of interconnected nodes.
I began by looking at quickchart.io, a tremendous service for generating charts and graphs from data. I’ve used it before to graph progress towards my writing goals. I browsed their gallery of charts, looking for a chart that would illustrate the idea of interconnected nodes.
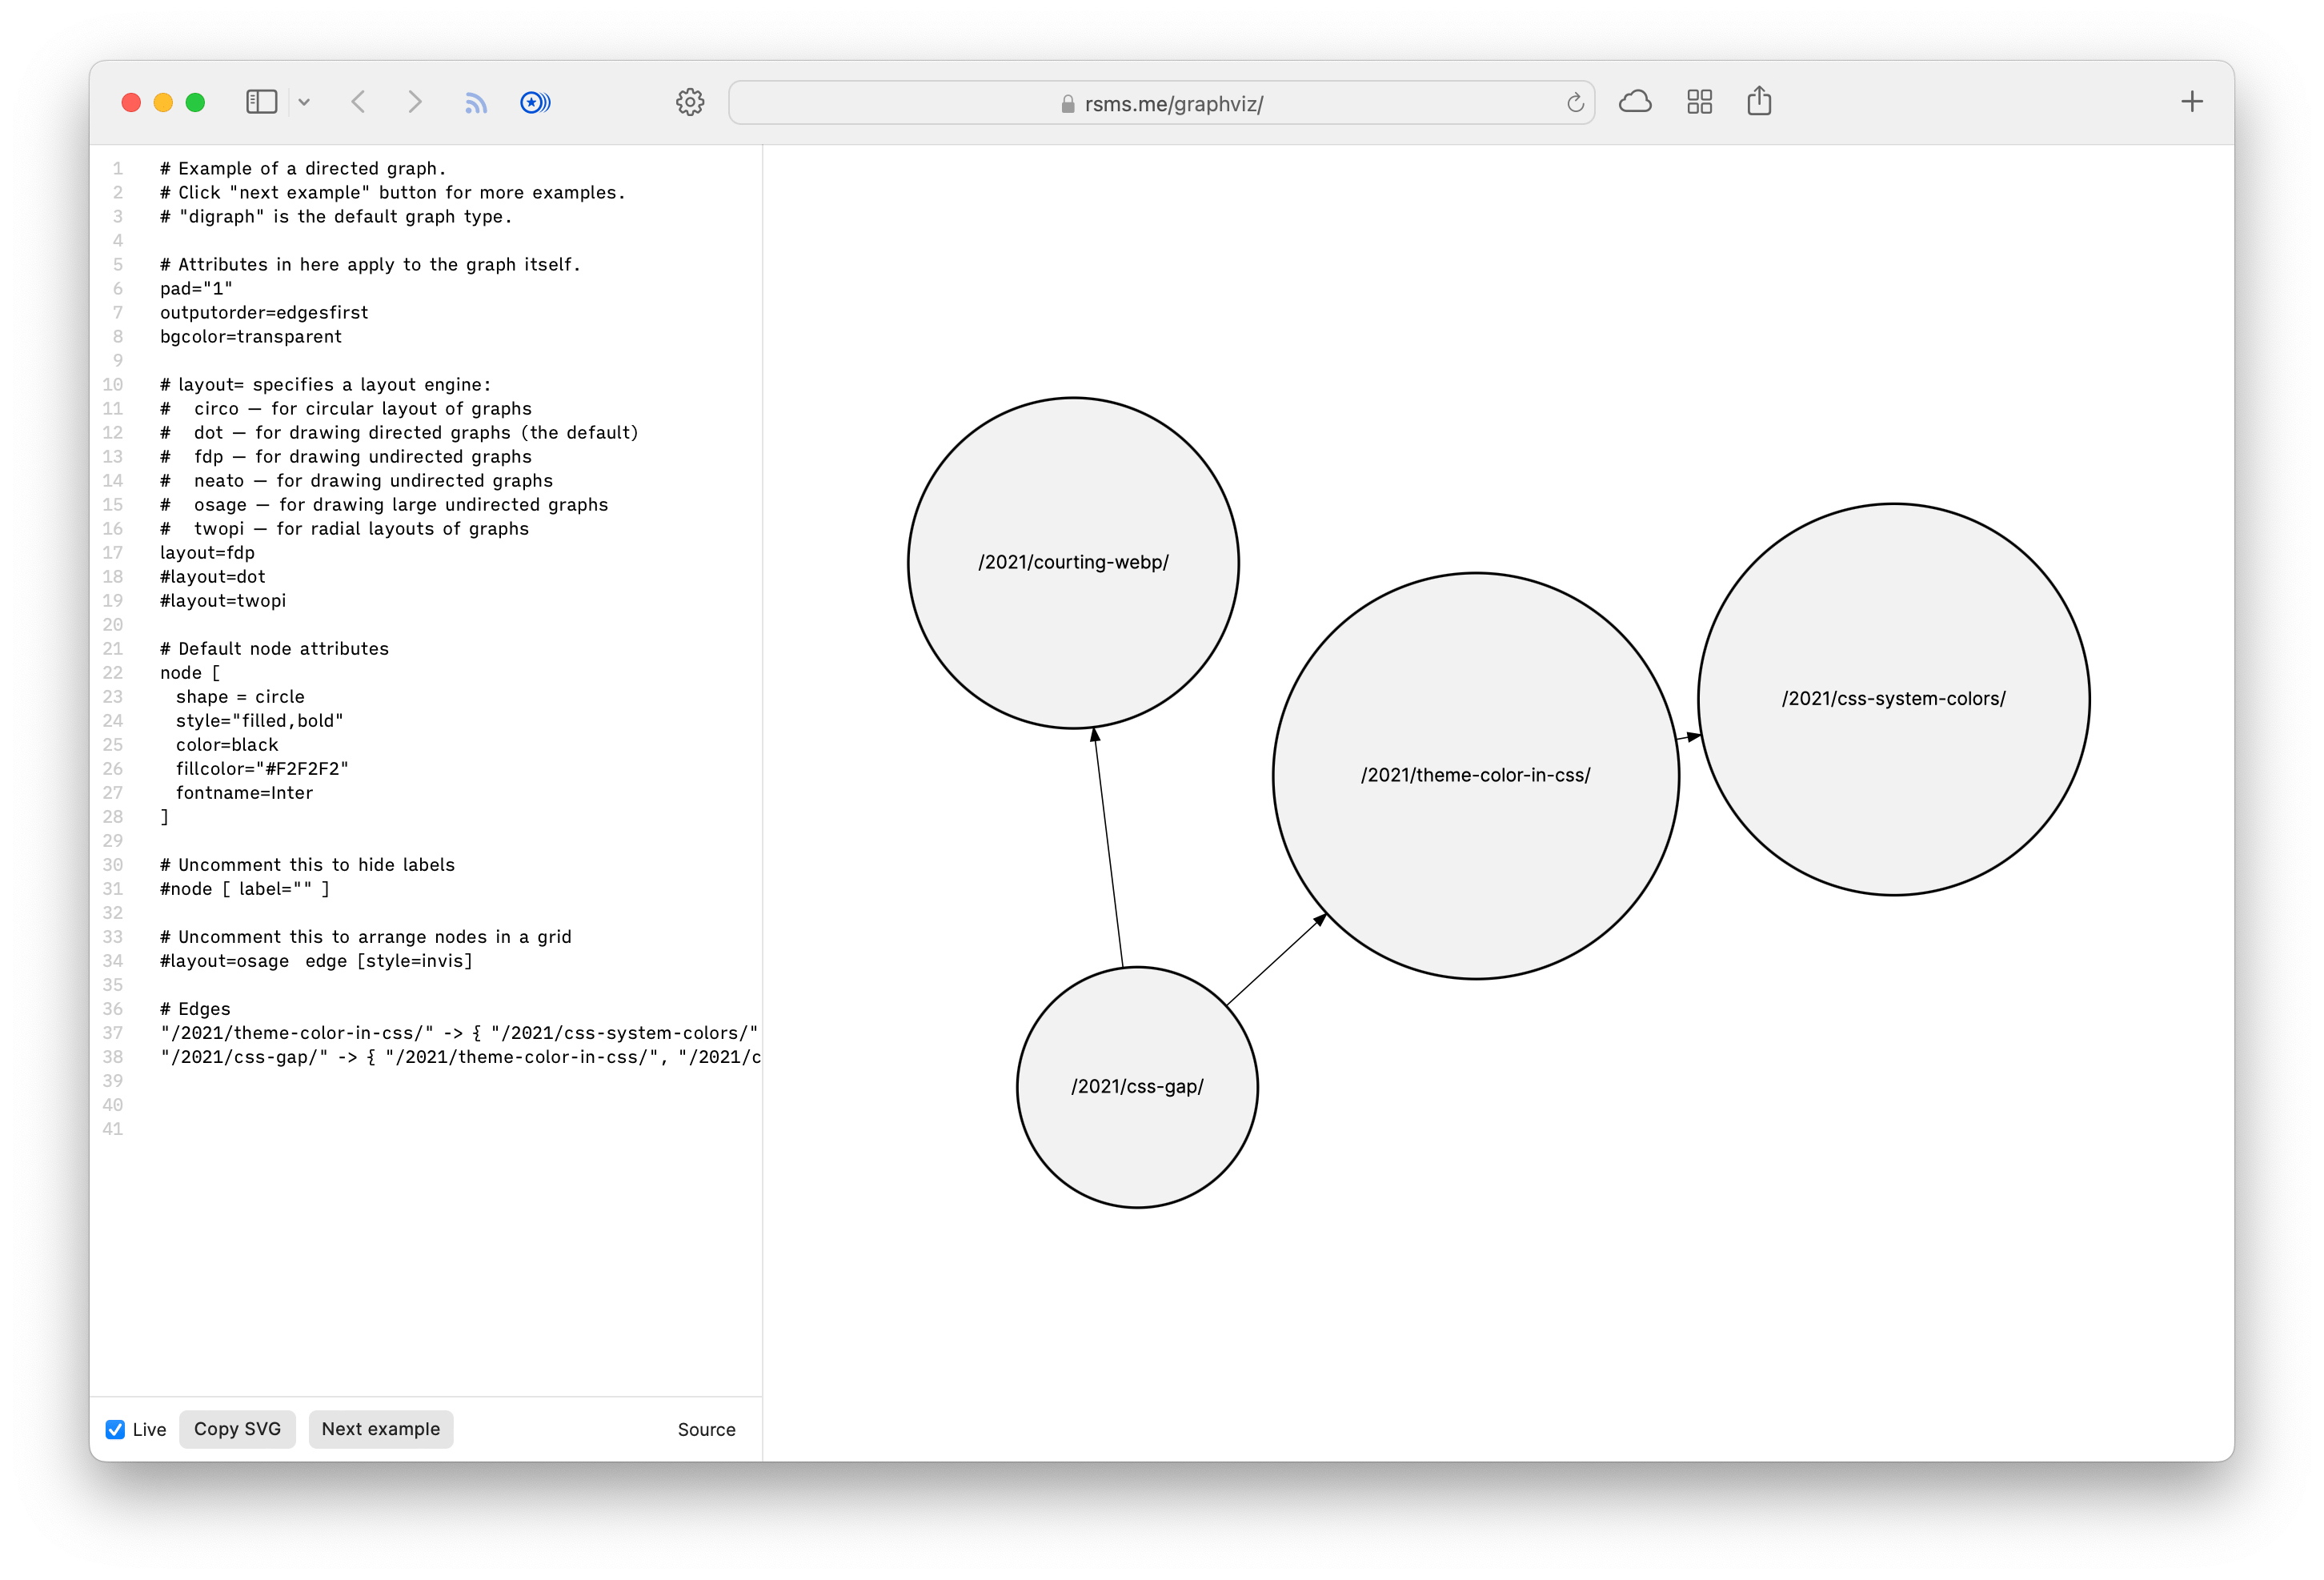
Through their docs, I found out about GraphViz charts, which led me to Rasmus’ graphviz in the browser. Using his online tool I was able to glean what a proper data set would look like to formulate a GraphViz chart. So I started indexing the data in my blog’s build process.
First, I wanted a mapping of every blog post on my site with its internal links. I was able to get that data by plugging into my markdown parser: marked.js.
let internalLinksByPath = {};
posts.forEach(post => {
  // For each post, I take its markdown content:
  //   post.markdown: "A [link](/to/thing/) here."
  //
  // And parse it, getting back the markdown as HTML, as well
  // as a list of the links in that piece of markdown:
  //   markdown: "A <a href='/to/thing'>link</a> here."
  //   internalLinks: ["/to/thing"]
  const { html, internalLinks } = parseMd(post.content);

  // Then I create a site-wide object representing all the
  // internal post links on my blog. Example:
  // {
  //   "posts/foo/": ["/posts/bar"],
  //   "posts/bar/": ["/posts/foo", "posts/another"]
  // }
  internalLinksByPath[post.path] = internalLinks;
});
That gave me all the internal links on my site by path. From there, I used Rasmus’ browser-based tool to understand how to map my links as a JavaScript object to a GraphViz query. That code, for illustration purposes, looked like this:
// Takes site links: (Object.<string, Array.<string>>)
//   Example:
//   {"/post/foo/": ["/posts/bar/", "posts/baz/"]}
// And turns them to a GraphViz query (`digraph { QUERY }`)
//   Example:
//   `"/post/foo/" -> { "/posts/bar/", "posts/baz/" }\n`
const query = Object.entries(internalLinksByPath)
.map(
  ([path, links]) =>
    `"${path}" -> { ${links.map((link) => `"${link}"`).join(", ")} }`
)
.join("\n");
A few iterations of copying from a console.log and pasting into the browser-based tool allowed me to perfect the structure of my query to properly draw a real diagram.
Once I knew I was formulating the right code to draw a GraphViz chart, I started formulating the code to hit the quickchart.io API and get back an SVG. But I abandoned that idea pretty quickly because I still didn’t really know exactly what I was doing and the feedback cycle of prototyping this thing I wanted to ultimately end up on my website was too slow. I wanted a faster way to prototype.
So I tried putting Rasmus’ browser-based tool on my website. I followed the instructions in the README but couldn’t get it working. Then I realized that Rasmus’ tool was merely a wrapper around viz.js which (I believe) is a webassembly implementation of Graphviz. (That’s a lot of levels deep, I know, but I couldn’t stop at this point!) A little more finagling with viz.js and soon enough I had a chart in the browser on my website which I could tweak and refine.
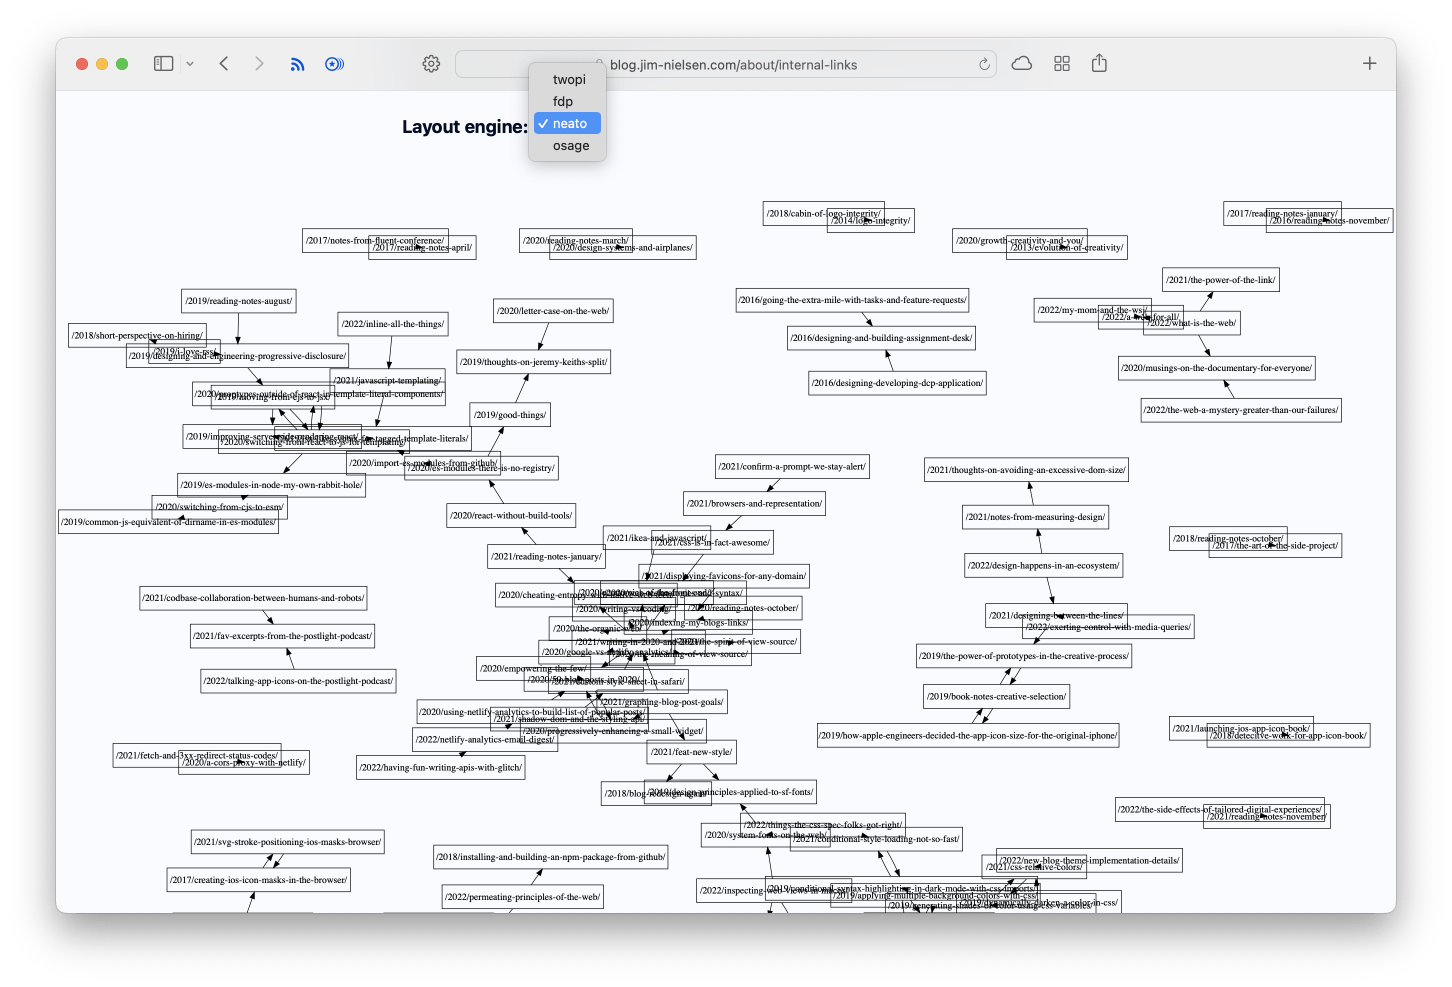
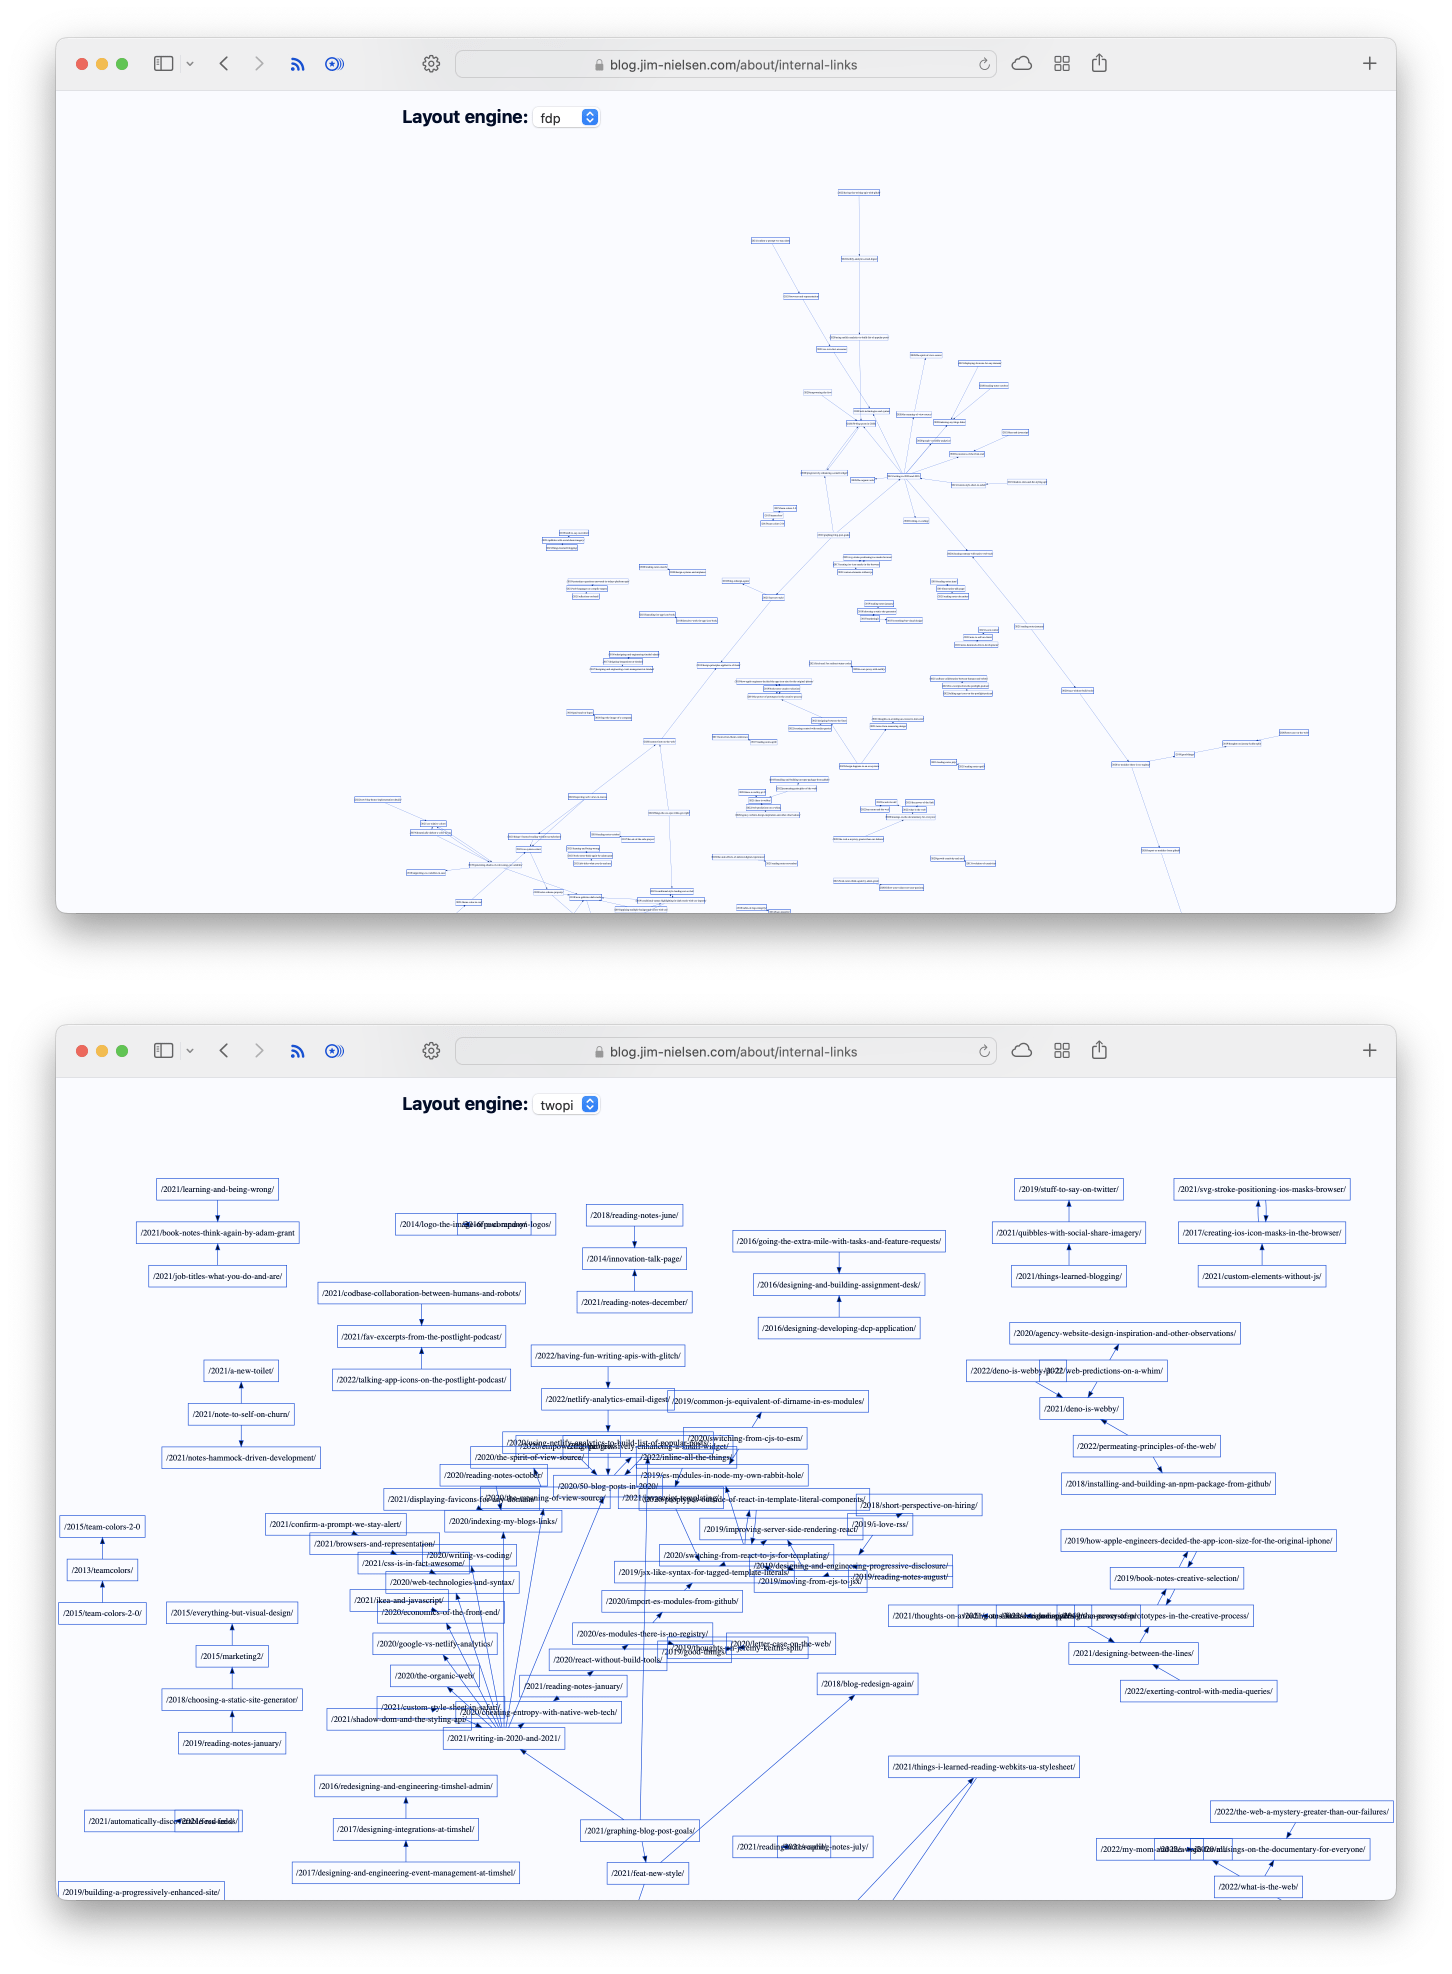
From there, I experimented with a couple of the different layout algorithms. To be honest, I don’t know what goes into drawing each one, but it’s neat to toggle between the different layout modes.
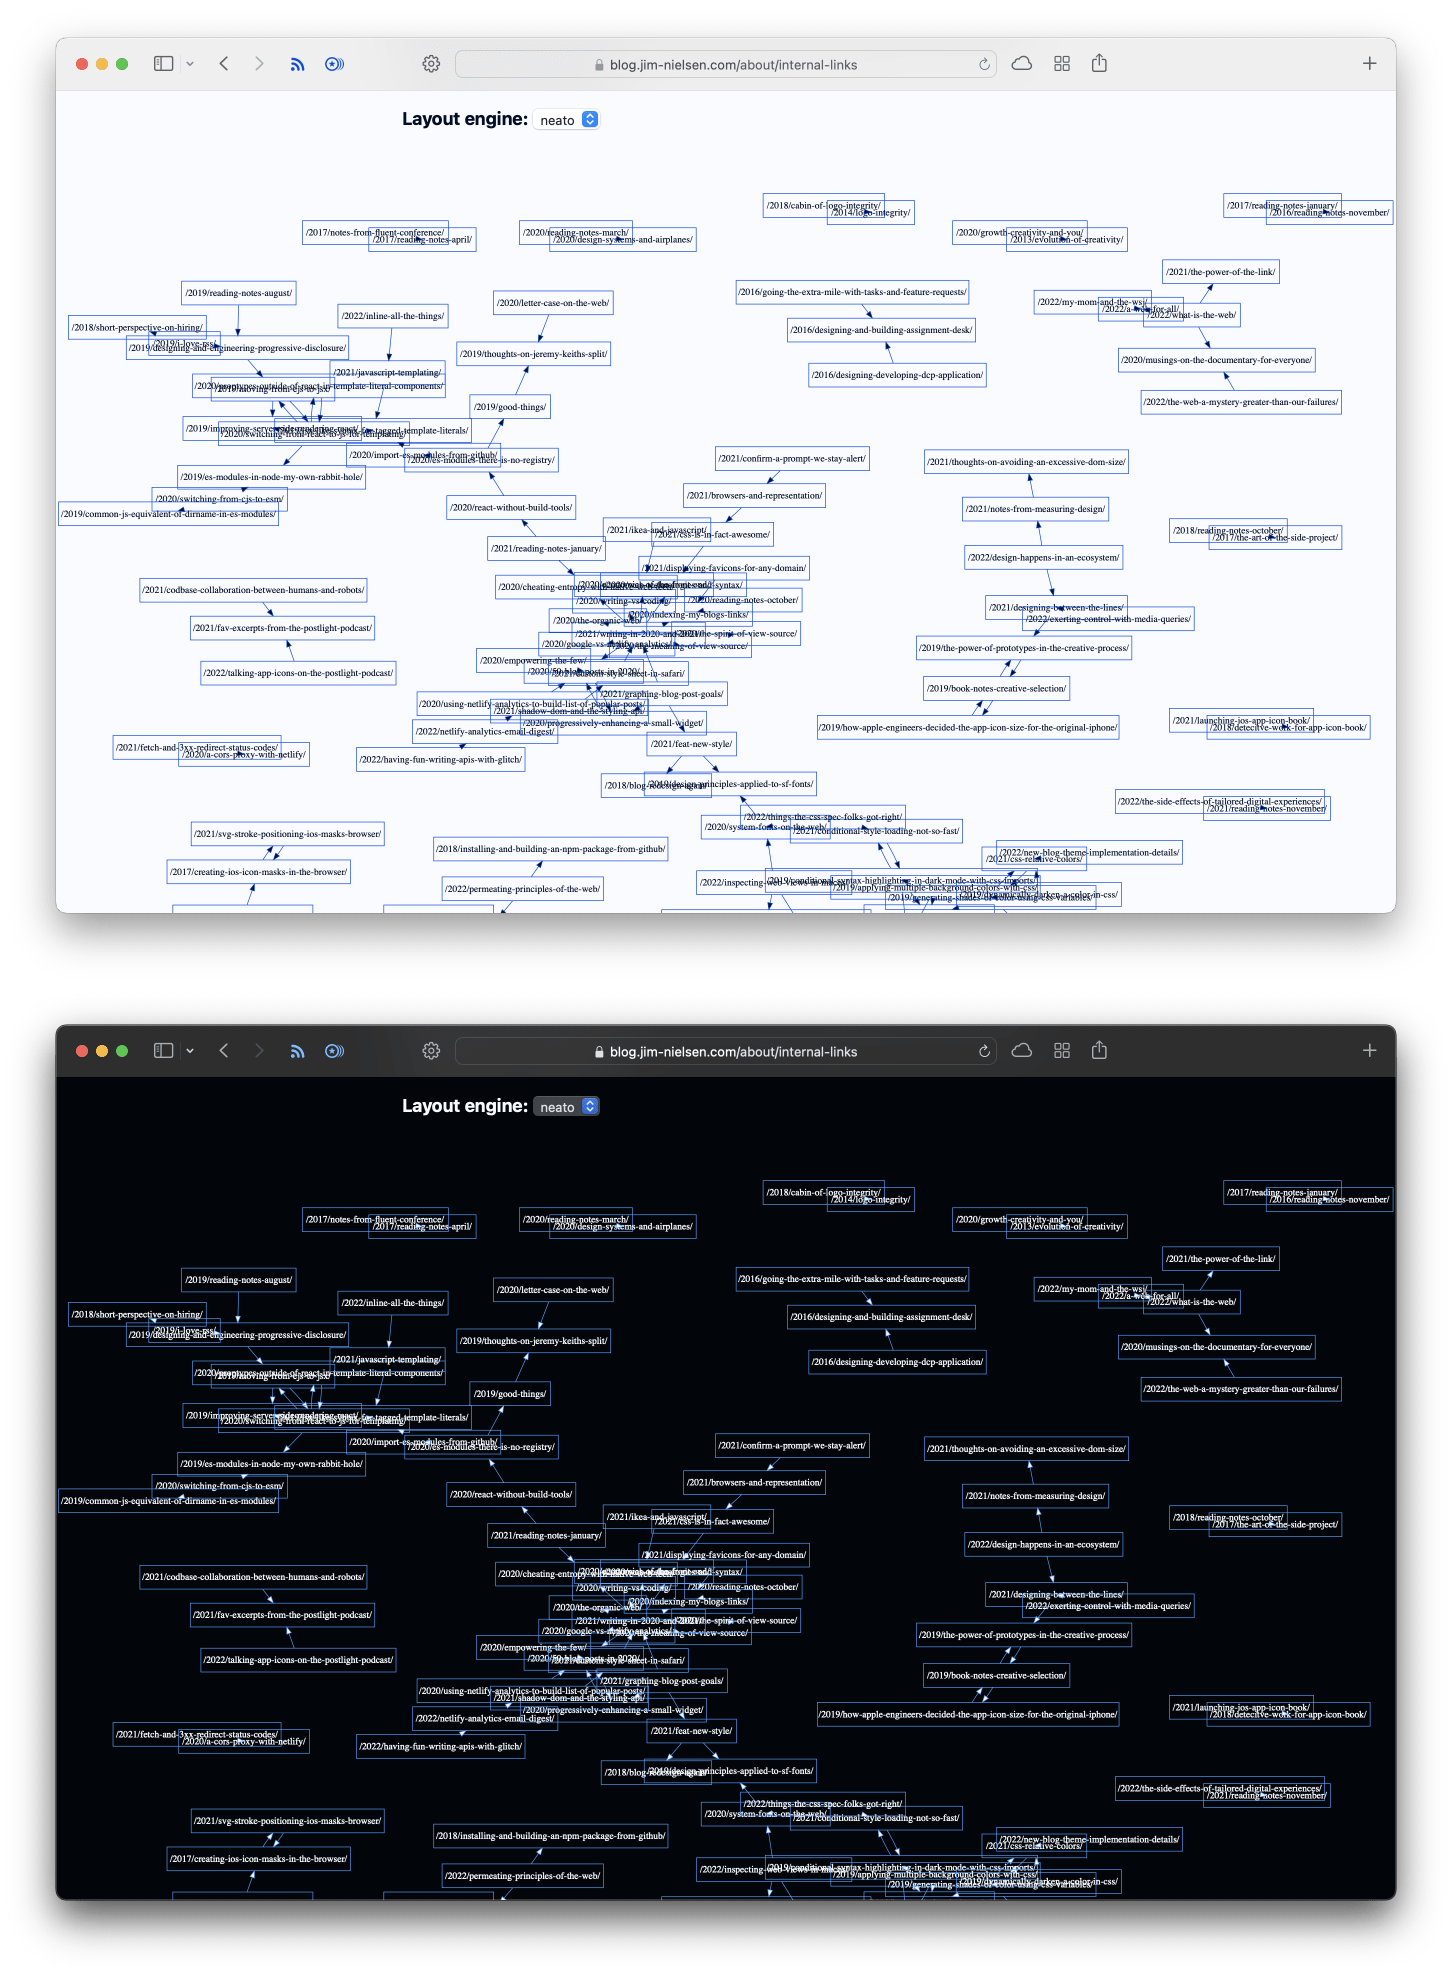
You have the ability to customize the appearance of your graph with colors and all that, but because it generates an SVG with hard-coded color values like #ffffff and #000000, I used CSS attribute selectors instead to override the hard-coded SVG colors with my own CSS variables, which makes the graph look like part of the active theme on my website.
#root svg [fill="#ffffff"] {
  fill: transparent;
}
#root svg [stroke="#000000"] {
  stroke: var(--c-theme);
}
#root svg [fill="#000000"] {
  fill: var(--c-text);
}
This made theming the graphs for dark mode super easy.
There’s still a lot of room for improvement in these, like more natural support for panning/zooming, as some charts (depending on layout mode) become a bit unreadable. But I’ll get to that later—maybe.
Overall, I had lots of fun going from idea (how can I visualize the links between all my blogs?) to execution (a graph of interconnected nodes generated from metadata extracted from my blog).