Jim Nielsen’s Blog

You found my experimental HTML feed (there are also other ways to subscribe).

I ♄ HTML

Recent posts

Can We Stop With the Uptime Percentages?

View

I was reading Jason Gorman’s article ā€œThe Wall Confronting Reliable Coding Agent Autonomyā€ and he says:

the journey from 90% to 99% reliability is just as hard as it was to get to 90%. And from 99% to 99.9% is just as hard again.

This stood out, as I’ve been experiencing more and more ā€œdowntimeā€ in my day-to-day work. GitHub’s down. CI’s down. AI’s down. Slack’s down. Downtime’s going mainstream! More and more I find myself visiting service status pages, where I’m confronted with a wall of colors and numbers like this:

Screenshot of the mobile status pages for Claude and GitHub, each showing charts and uptime percentage numbers.

100%? 99.72%? 99.09%? 98.98%? Those don’t all seem so different or bad? I mean, those are all an A in grade school.

Then I have to remind myself of Jason’s point and re-interpret the numbers, which is more like reading earthquake measurements. The difference between a 6.2 and a 7.8 might not seem that big, but it represents a massive difference in magnitude. Uptime percentages have a similar problem: 99.9% and 99.99% look pretty much the same, but the latter is 10Ɨ less!

Infrastructure people understand this. They even have a shorthand for it: two nines, three nines, four nines. They intuitively grasp the difference because they swim in these numbers every day.

But the audience for status pages isn’t just infra people anymore. It’s increasingly everybody.

I understand the math is straightforward. Percent uptime is a good metric for those in the industry. But it’s a lousy interface for people who don’t care about the best way to measure infrastructure reliability in a standardized, reliable, compliant way.

And status pages are the public interface for understanding the reliability of a service. I just want to know, ā€œDude, how much have you been down lately? Seems like a lotā€¦ā€

So how about, and I’ll just throw this out there, instead of:

GitHub Actions: 98.31% uptime.

We say something like:

GitHub Actions: 12 hours affected in the last 30 days (98.31% uptime).

One requires you to understand the nonlinear significance of numbers near 100%. The other requires knowing what an hour is.


Reply via: Email Ā· Mastodon Ā· Bluesky

Nobody Believes It, Everybody Does It

View

Speaking of things we know individually, but let slide collectively, here’s Jeremy Keith talking about how we all used Flash:

Remember when almost every website had a Flash intro? Everyone knew they were annoying and uneccessary, but everyone else was doing it.

And here’s John Gruber writing about his experience with those marketing schemes that trade your personal information for a discount:

The marketing shitbirds who press for these schemes  […]  do so by pointing to data that shows that they do convert some number of users. ā€œIt worksā€ they claim, pointing to data. What doesn’t show up in their data are interactions like mine. They don’t have analytics that measure that I now consider their website an antagonist to avoid at all costs.

There’s a funny thing about us humans: we place trust in systems that our own individual experience tells us are flawed. For example:

  • KPIs: we know metrics get optimized at the expense of reality, but leadership treats dashboards as a reflection of truth.
  • Performance reviews: we know they’re political and subjective, yet companies leverage them for promotions, compensation, even firings.
  • Standardized testing: we know tests don’t measure real ability, but institutions rely on them for admissions, funding, and rankings.
  • Terms of Service: nobody reads them, but the legal system acts like informed consent is given.
  • Privacy notices / cookie banners: everybody clicks through them mindlessly while companies claim transparency and compliance.

This behavior is best summed up by Scott Berkun in Confessions of a Public Speaker:

I know I avoid most surveys I’m asked to fill out, as do many of you, which begs the question why we place so much faith in survey-based research.

What’s convenient at scale becomes a substitute for the reality we experience as individuals (because scale excludes the parts of reality it cannot conveniently capture).


Reply via: Email Ā· Mastodon Ā· Bluesky

My Experience Has Nuance, Yours Is a Data Point

View

Eric Bailey has a fun little post about how we need more than a few icons to express the nuance of our shared human experience.

For example, he suggests Netflix provide some feedback buttons to indicate the kinds of experiences we all share consuming and rating media:

  • ā€œJust because I expressed interest in this show does not mean I want to be inundated with recommendations for its genreā€
  • ā€œDisregard [that I pressed ā€˜thumbs up’] my cat walked over the keyboardā€
  • ā€œI am making bad choices and hatewatching thisā€ (which reminds me of )

What’s great about the examples in Eric’s post is how familiar they are. We can read them and laugh because we’ve had the same thought — ā€œI’m pressing ā€˜thumbs up’ here, but what I really mean isā€¦ā€

We know when we click that button that it’s a reductive expression of our experience that’ll be erroneously interpreted, but we do it anyway. As Bryan Cantrill shared from his experience:

There's no way to indicate, ā€œI’m engaging with this, but I hate myself for doing it.ā€ I need another mouse button that is like, ā€œI’m clicking on this, but I’m rage clicking on it and for my own mental health could you not drag more of this in front of me please?ā€

We know these feedback mechanisms are often a misrepresentation of our actual experience.

Yet we turn around in our professional contexts and see numbers like ā€œ142,432 users gave this a ā€˜thumbs upā€™ā€ and we forget everything we knew about our own individual experience with these systems. We make it mean what we want it to mean, what’s convenient for measurement and reporting e.g. ā€œWow, what a great insight about our offerings! Let’s restructure our entire catalog around this new, objective, (pseudo)scientific fact that so many people obviously like this thing!ā€

We reduce the experiences of others to mere data, but grant ourselves exemption from such oversimplifications.

Where’s the conversation around:

  • Values, e.g. ā€œShould we provide more of this? We can say no to the dataā€¦ā€
  • Nuance, e.g. ā€œWhat do people really mean when they click ā€˜thumbs up’ in this interface?ā€
  • Vision, e.g. ā€œIf we provide more of this, where will that lead us?ā€

But that’s too introspective. Introspection is slow. Ain’t nobody got time for that.


Reply via: Email Ā· Mastodon Ā· Bluesky

Related posts linking here: (2026) Nobody Believes It, Everybody Does It

A Calendar View For My Blog

View

807 blog posts across 14 years.

That’s how much I’ve published on my blog at the time of this writing.

And here’s the question I’ve been turning over in my mind: ā€œHow do I convey that kind of volume across time in a more interesting way than a mere reverse-chronological list?ā€

I’m not hating on reverse-chronological lists. I love my list view. I use it all the time to find stuff I’ve written.

But it’s only one way of navigating and digesting all my posts.

ā€œWhat would be another way?ā€

Surely there are many answers to that question. And I’ll probably be exploring them more and more over time.

But I had an idea for a new view that I built out and shipped: my calendar view.

Screenshot of the calendar archive on Jim Nielsen’s blog where it shows a calendar for 2026 with red dots on various days through the year.

It’s also just a reverse-chronological view, but it’s meant to convey a sense of posting patterns through time more than it is meant to be a good browsing experience of content.

The view is simple: a calendar view of days in each year, and if I posted on a day, it gets a circle (bonus: if a post hit hacker news, it gets an orange square instead).

Screenshot of the month of July with its day. A few days have a red circle and one day has an orange square, with a pop-up tied to it denoting the post’s title and that it hit hacker news.

You can click on the dots to see the names of the posts from that day (and follow the link to them, but really this view is basically to scratch an itch of mine.

Because you can just make stuff for yourself, and that’s what I’ve done here. And now I’m writing about it because that means I get another little circle for today! Good job, Jimbo.

Check it out


Reply via: Email Ā· Mastodon Ā· Bluesky

Have You Heard the Good News About Microlighter?

View

Dave Rupert wrote about shipping microlighter: a tool for handling syntax highlighting using the CSS Custom Highlights API. I saw his post the day he released it, and I had an implementation PR up for my blog by end of day.

Then, like I do with so many things, I let it sit there.

This is the period where my subconscious takes over. It does the work of, ā€œHow do I actually feel about that? Do I want to merge it? Do I have any regrets about what I did?ā€ If I still want to merge it after a few days, that’s usually a good sign that I’ll be happy with the work. (Sometimes after a few days I say, ā€œWhat the hell was I thinking?ā€ and then it’s easy to simply close the PR with zero regrets.)

Well it’s a few days later and I still feel good about it, so time to ship!

My PR for this is pretty straightforward:

  • Remove highlight.js dependency (and related plumbing)
  • On paths that 1) match my post pages (i.e. /YYYY/:slug), and 2) have code on them, pull microlighter deps from a CDN and run it.
  • Done.

Granted, there are trade-offs to this approach. I get it. Dave’s explainer for this tool on The ShopTalk Show vibed with me because I’ve been in his shoes many times: ā€œWhoops, somehow syntax highlighting on my blog is broken again. Guess I need to fix it. Ugh. I’ve done prism, I’ve done highlight.js, I’ve done shiki. What should I do this time? Could I do this in a way that’s just less?ā€ He clarifies:

I’m not coming at this like, ā€œEveryone is doing it wrong!ā€ I was just kind of like, ā€œCould I do this in a way that suited me?ā€

Well, this approach suites me.

There’s a kind of conceptual elegance to it where syntax highlighting lives in the realm of a styling operation rather than a content transformation plus styling. In short: syntax highlighting, i.e. styling text, is a styling concern so solve it with CSS — no DOM manipulation required!

Plus, I mean, how cool is it that the code on the website is the same as the code in the DOM?!?

Screenshot of the microlighter website with the webpage code sample on the left and the devtools open on the right to the same code in the DOM and there are no span tags wrapping the code!

I guess this is how I know I still like working on the web, because seeing browsers do stuff like this that they couldn’t do before still feels really cool!


Reply via: Email Ā· Mastodon Ā· Bluesky

Getting an LLM to Make Me a Tool for Enriching the Color Metadata in My Icon Collection

View

On my icon gallery sites, I have metadata I’ve manually added over the years to tag certain icons as being predominantly ā€œblueā€ or ā€œorangeā€ or some other color.

Then I use this metadata to present icons of (roughly) the same color. It’s kinda neat to be able to browse a wall of icons that are all the same color.

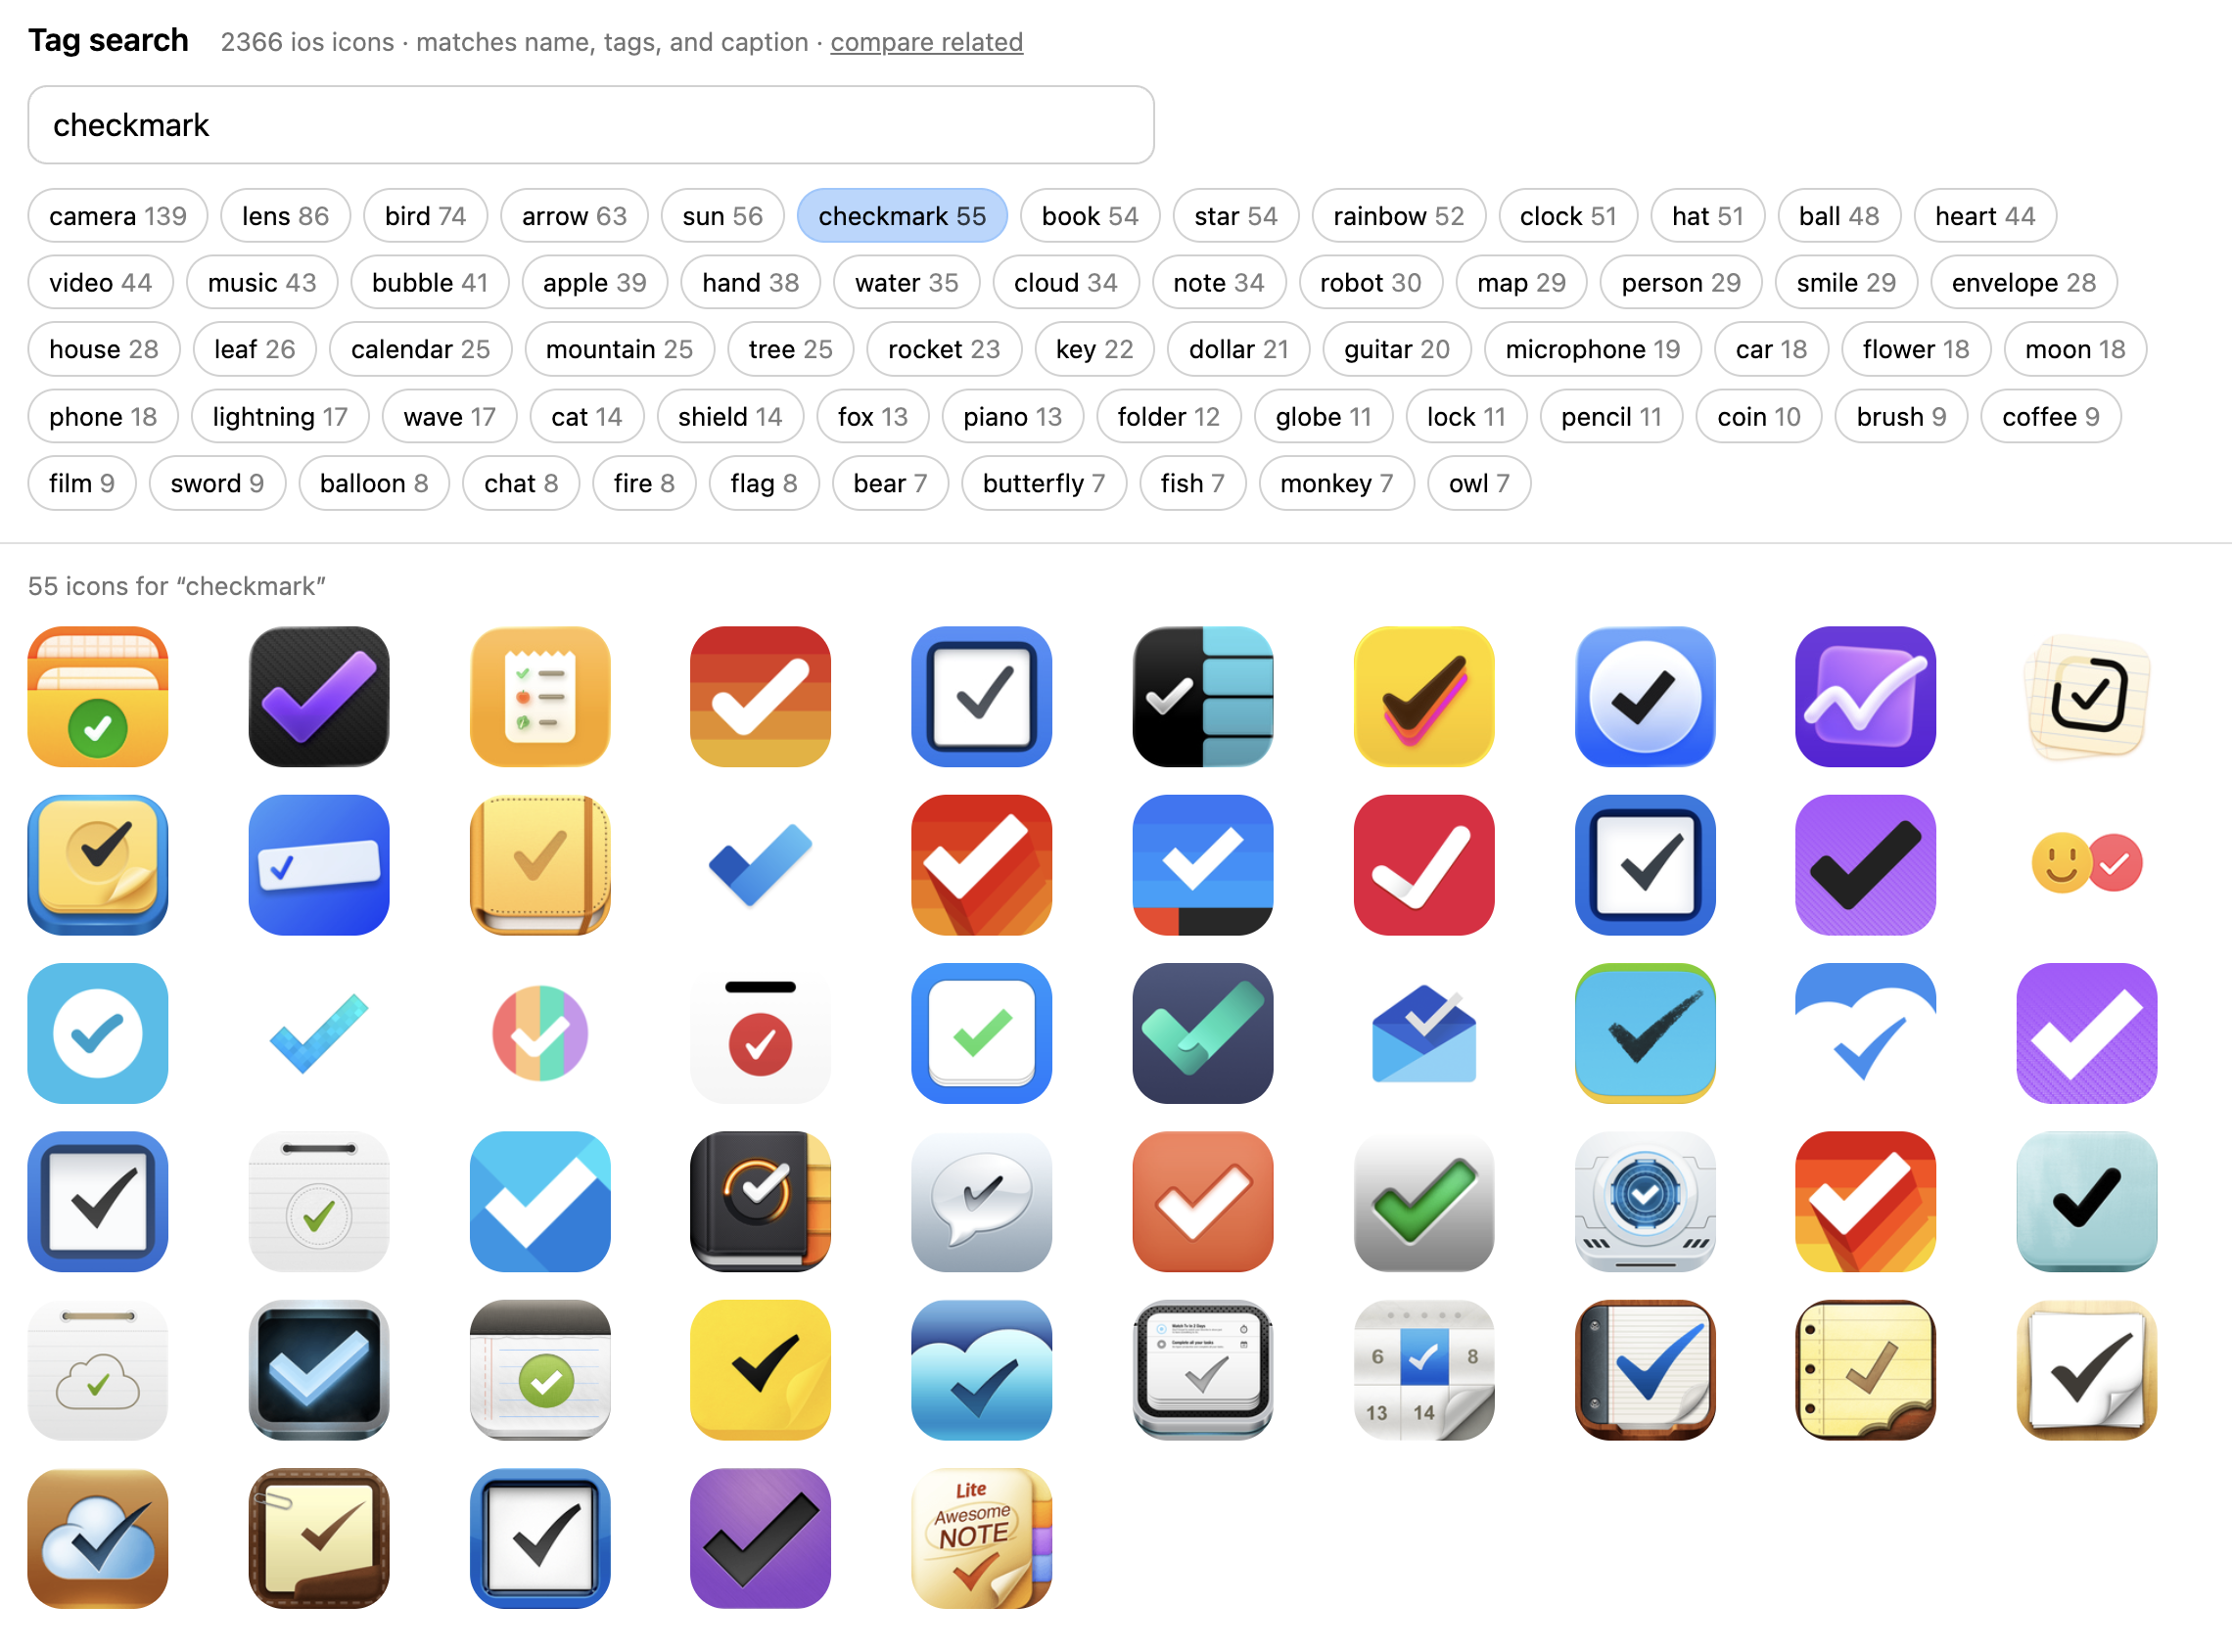
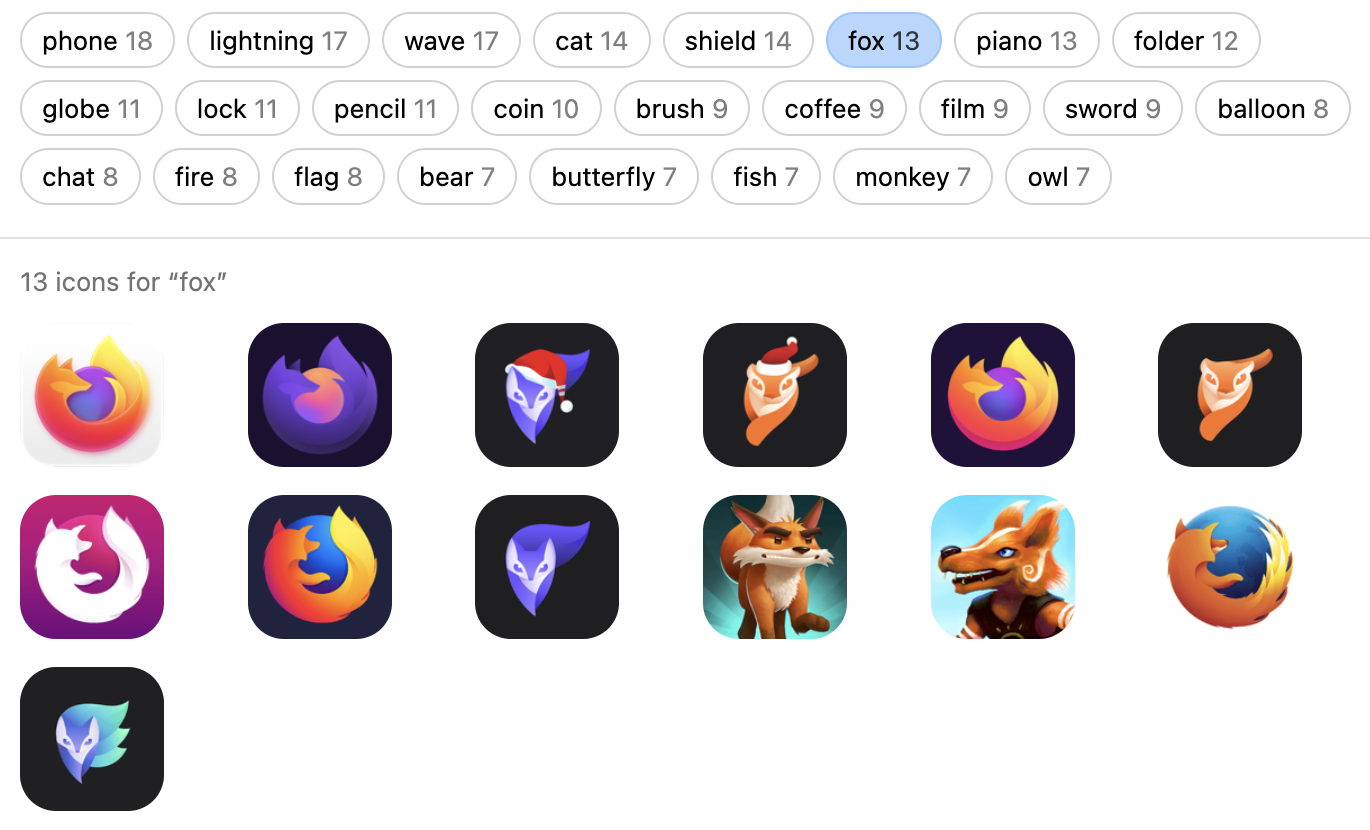
Screenshot of a wall of icons tagged as ā€œpurpleā€ on iosicongallery.com

The thing is: I know there are a lot of icons I’ve missed tagging over the years. But I have no idea how many, and figuring that out seems like a really arduous task. How do I go through 2,000+ icons and find all the ones that look predominantly ā€œorangeā€ but haven’t been tagged as such yet?

Seems like a good task to throw at an LLM. But I don’t want to just say, ā€œGo tag everything that’s missingā€ and blindly trust the output. I need to be able to make a decisions as to whether I think a particular color is ā€œorangeā€ or not.

What I need is a tool for the job. I’m a very visual thinker, so to continue curating these color categorizations, I need some way for the computer to do its thing really, really fast, and then pull me into the loop to visually make decisions.

Here’s how I am thinking about about accomplishing this task:

  • Create a page with a list of colors on the left (red, green, orange, blue, etc.)
  • When a color is clicked, show two columns. 1) All icons I currently have tagged for that color, and 2) all icons that might be that color but aren’t tagged as such (you, computer, process all my icons and do the work to figure this out and make recommendations).
  • Allow me to select one or more icon(s) in the ā€œnot yet tagged as this colorā€ column. Once I have all the ones I perceive as missing, give me a button to say ā€œCopyā€ which copies the IDs of those icons.
  • I’ll paste the IDs back here in the chat and you go add the corresponding metadata.

That seems like it would be a good tool to put me in control of visual decision making around color categorization. So I tell the LLM to run with it.

We chat back and forth. I think, ā€œYou probably need to run all the icons through some model to make the correlation?ā€ But it’s like, ā€œNah bro, just make a ā€˜hue histogram’.ā€ It tells me how. For a color like ā€œorangeā€, I can:

[process] each PNG, skip transparent pixels, skip low-saturation gray, convert the rest to HSV, and score how much of the remaining mass sits in the orange hue band (roughly 15–45°). Rank icons that don’t already have colorId: orange.

Ok, sure. That sounds reasonable.

[This] scores each icon PNG by share of opaque pixels per color bucket, then writes a standalone HTML page: tagged vs maybe-missing, per color.

Let’s just make it, and then I’ll decide whether it’s good enough.

After a few iterations, the computer going ā€œbrrā€¦ā€, and me saying ā€œexplain that like I’m dumbā€, I have a really effective little tool!

Screenshot of a tool showing a collection of orange icons side-by-side, representing icons that have been tagged orange in my collection vs. ones that haven’t.

The little threshold slider is a nice touch. It lets me fiddle around with the fidelity of the matches. In some cases, sliding it down reveals more icons I would’ve otherwise missed. In other cases, I’m like ā€œWhat are you thinking? I don’t see that as ā€˜yellow’ at all!ā€

Supper effective little tool. I go through each color, select the ones I think are missing, paste the IDs back into the LLM, and then have it update each icon's metadata.

Boom, done! That all would’ve taken so long before. I would’ve never done it.

Takeaways:

  • The LLM is good at making throw-away code. This doesn’t need to be ā€œproduction-gradeā€ code I depend on. Just something that’s good enough for me to get a job done, then toss. The resulting metadata is the goal, not the tool I use to get to the goal.
  • The LLM is good at making one-off HTML pages for a specific task. In my case, all these images were hosted on a CDN, easy enough to just point at and have a standalone .html file that I can locate on my hard drive and open directly as a file:// URL. No bundling. No transpilation. None of that. I don’t even need a web server! Keeping things very basic on this project is paying off: I had really elemental building blocks that didn’t require additional third-party tooling. Just HTML, CSS, a little in-page JS, and images on a server!
  • It’s fun to say, ā€œDon’t do the work for me. Instead, help me make a custom-fit tool that facilitates me doing the work in the most empowering, correct way possible.ā€

Reply via: Email Ā· Mastodon Ā· Bluesky

A Sloppy Interface Is a Security Liability ļæ¼

View

In his talk ā€œWhy AI Is Breaking Software Security As We Know Itā€ (my notes here), Feross Aboukhadijeh talks about the Axios npm incident and how the maintainer got phished by succumbing to (amongst other things) a faux Microsoft Teams interface:

this is the kind of thing that AI makes easy to do, because it can vibe code that whole fake Microsoft Teams interface pretty trivially

You’ve probably seen these: interfaces designed to look like some other product in order to provide a facade of authenticity and exploit someone.

What struck me in listening to Feross was this idea of how the quality of your interfaces can be a protection mechanism against attackers.

I don’t know if I’ve ever heard someone say that out loud — interface and interaction design as a security control — but I’m saying it.

Now, of course, not everyone will consciously notice the level of polish that world-class professionals imbue in digital interfaces. But some will.

Personally, I’ve always used the quality and care of digital experiences as a heuristic for judging authenticity — and competency to be honest, e.g. ā€œIf this UI is so bad, what else will surely be bad?ā€

Granted, it was a much more dependable heuristic before AI came along. But even now, I can still suss out slop and carelessness which is a skill that continues to be a reliable, protective form of digital literacy (for me).

That’s all to say: a sloppy, careless approach to interface design not only hurts your brand in terms of customer perception, but it can be an attack vector. The easier it is to sloppily reproduce what you sloppily ship, the easier it will be for your product or brand to be leveraged as a vehicle for exploiting your customers.

If everything you make was produced from a single prompt, then everyone else is one prompt away from imitating you. The easier something is to make, the more likely it’ll be in the genre of ā€œeasy to exploitā€.

One way to protect yourself (it’s not the only one way, security is never a binary ā€œyou are / are not secureā€) is to do that extra work to make your experiences go above and beyond what you can easily get out of an LLM.

The protection here is having an interface and experience that is hard to replicate with the same level of fidelity that discerning users will notice — things like micro-interactions, loading behavior, UI copy and voice, handling of edge-cases, etc. That’s the stuff that’s hard (and expensive) to fake because it’s hard (and expensive) to notice you need to fake it.

tl;dr — Fidelity to craft is not only valuable from a product standpoint, but it’s also valuable from security standpoint. If attackers are going after low-hanging fruit, your fruit will be harder to reach if it’s up high.


Reply via: Email Ā· Mastodon Ā· Bluesky

Oops, Should’ve Thought of That

View

Gordon Brander writes:

The thing about computers is that they can do anything you wish, so long as you specify your wish in exacting detail. However, LLMs relieve this constraint. An LLM can extrapolate what you mean (more or less) from just a few words. So computers can do vibes now.

It used to be that computers could only ever do exactly what you told them to do, nothing more.

If they did something unexpected (a.k.a. a bug), it was because you failed to 1) anticipate it could happen, or 2) specify with greater detail that it shouldn’t happen.

But in this new world, computers can extrapolate your intent.

LLMS can act like a fill-in-the-gap machine, which alleviates you from the pedantic demands of coding from years past.

There’s going to be a lot more ā€œOops, I didn’t mean to do thatā€ in the future.

This should be what separates professional practitioners from hobbyists.

A good practitioner recognizes that leveraging some foresight is part and parcel of the job in order to mitigate unintended consequences.

Meanwhile, a hobbyist or amateur doesn’t even have the capability or experience to understand the assumed intent of an LLM until it’s too late and users have been affected.

Software we use everyday, software that many aspects of our lives increasingly depend on, needs less unintended consequences. Less ā€œOops, should’ve thought of that.ā€


Reply via: Email Ā· Mastodon Ā· Bluesky

Oh Hey, It’s Not Just Me

View

My whole life I’ve felt like I have great eyesight (and I still do).

But lately I’ve been noticing what feels like…some slippage.

Nothing big. Just this feeling in the morning like, as my brain and body wake up, my vision needs to as well.

The strange novelty of this phenomenon was operating in some small part of my subconscious the other day when I was scrolling the internet and come across this post from Chris Coyier:

you ever get to your mid fourties and have your eyesight drop off a friggin cliff

And I’m all like:

Leonardo DiCaprio Pointing Meme where he’s sitting on the couch pointing past the camera as if he is identifying and connecting with something. Caption says ā€œYes! It me!ā€

And then even more people weighed in on Chris’ thread, like ā€œHey me too!ā€

This is why I love the web. I continually get that feeling of, ā€œOh hey, it’s not just me!ā€ On both a personal and a professional level.

And for that I’m grateful.

I love being able to connect with people in a way that makes me not feel so alone (or weird) in my experience of life.

In a polarized digital world, it’s good to remember that the web can still draw you to folks rather than push them away.

We’ve got a lot in common.


Reply via: Email Ā· Mastodon Ā· Bluesky

The Fruits of AI

View

Terry Godier has a post titled ā€œMea culpaā€ (which, given his framing, might’ve been better titled ā€œClaude’s Culpaā€). I’m not sure how much to even trust anything in his post given the backstory, but this line stood out:

I was careless in relying on AI [...] without doing the work to understand

Let’s face it: carelessness is the grain of AI. It’s what the tool encourages and makes easy by default.

Without constant vigilance and deliberate, active participation to cut against this grain — to maintain an understanding — careless outcomes are the default fruit of AI.

And given how good humans are at being constantly vigilant and deliberate, it seems reasonable to expect more stories like this one.

To analogize, AI is pitched like having your very own fruit tree. ā€œPlant a seed, and soon enough, boom! Yummy, juicy fruit for you! So fast and easy!ā€

But, like most things, it’s not that easy.

Getting good fruit requires all kinds of effort: planting, fertilizing, watering, pruning, thinning, cutting out disease, etc.

Good fruit requires cultivation and care.

Otherwise you’ll just end up with something that looks like a peach, but when you (or someone else) bites into it, you realize it’s disgusting and barely edible.


Reply via: Email Ā· Mastodon Ā· Bluesky